gSignature ROI calculator: how much will you actually gain from centralized email signature management?
October 30, 2025

Why measure the ROI of email signatures at all?
In 2025, what is an email signature in practice? It is a micro-communication medium and a permanent part of the work process: it works in every email, on every device, and in every department. A well-implemented HTML email signature simplifies the daily work of IT/HR/marketing, and at the same time can drive traffic (CTR) and leads. The gSignature ROI calculator therefore combines two effects: • operational effect: reduced workload for teams (time and cost of e-mail signature administration),
• marketing and sales effect: additional clicks on the email signature, leads and customers from micro-CTAs.
What parameters does the calculator take into account?
The calculator uses the input data visible in the panel (sample values based on the average results of gSignature customers). You can overwrite them with real numbers from your company at any time.
Organization and operating costs
• number of employees,
• total cost of 1 hour of work by teams dealing with e-mail signatures (IT/HR/marketing/sales/administration),
• weekly time spent on manual e-mail signature management (on average),
• percentage of maintenance time after gSignature implementation (maintenance).
Business parameters
• average monthly revenue per customer,
• conversion from website to lead,
• conversion from lead to customer,
• CTR from e-mail signatures (clicks on links/banners/CTA),
• email volume (monthly, total and/or per employee).
License cost
• monthly cost of gSignature (according to the selected plan).
Additionally, the calculator allows you to save settings (email) to return to comparative scenarios.
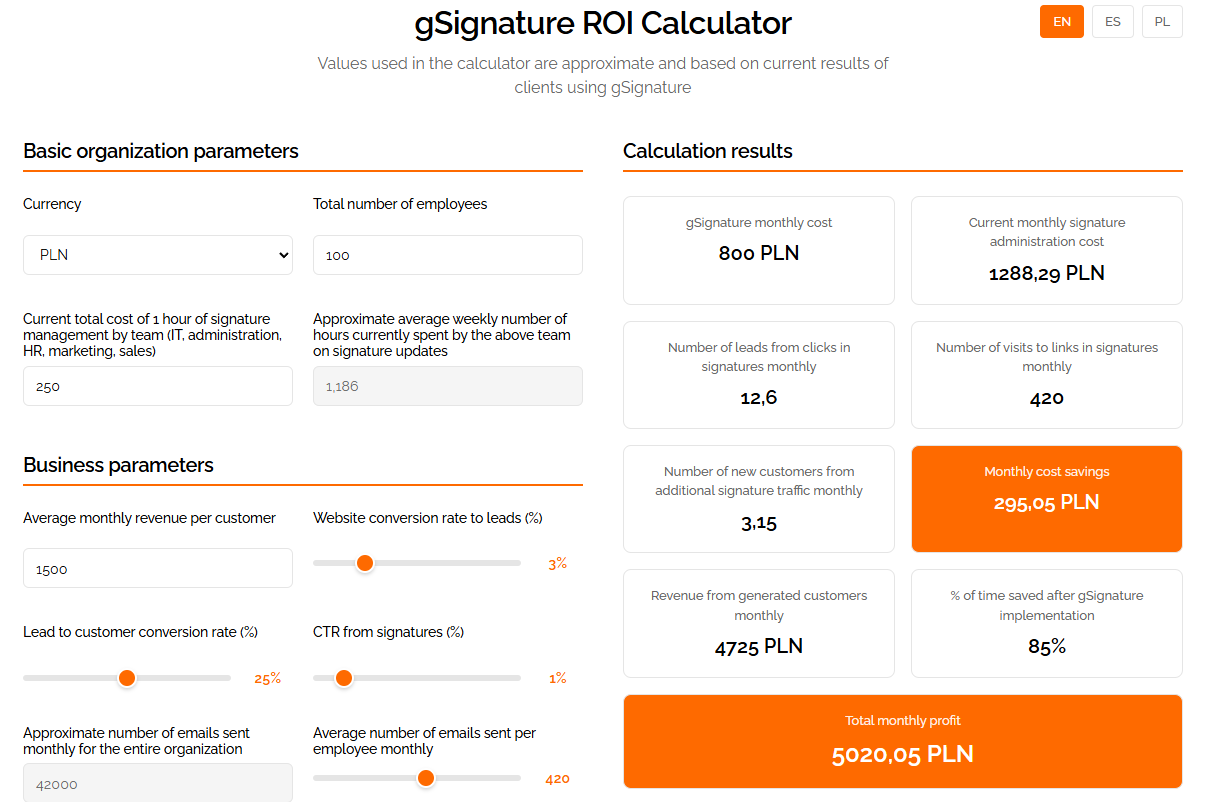
Sample scenario: what do the numbers say?
Let's assume the following parameters (from the example model):
• 100 employees,
• $150 — total cost of 1 hour of work for people “touching” e-mail signatures,
• 1.186 hours per week — average time spent on e-mail signatures,
• 15% — the amount of time left for maintenance after implementing gSignature,
• 42,000 — number of emails sent per month (entire organization),
• 1% CTR from e-mail signatures,
• 3% conversion from website visit to lead,
• 25% conversion from lead to customer,
• PLN 1,500 — average MRR per customer,
• PLN 400 — assumed monthly cost of gSignature (example).
What does this mean?
• E-mail signatures visits: 42,000 × 1% = 420 clicks per month.
• Leads: 420 × 3% = 12.6 leads/month (the model accepts decimal numbers).
• New customers: 12.6 × 25% = 3.15 customers/month.
• Revenue: 3.15 × $1,500 = $4,725/month (new MRR).
• Current administration cost (before gSignature): $772.98/month.
• Cost after implementation: 15% of PLN 772.98 = ~PLN 115.95 maintenance + PLN 400 license.
• Operational savings: 772.98 − (115.95 + 400) = PLN 257.03/month.
• Total “additional” financial result: PLN 4,725 (revenue) + PLN 257.03 (savings) = PLN 4,982.03/month.
• IT/Administration ROI: 64.26% (savings ÷ gSignature cost × 100%).
• Marketing ROI: 1,081.25% ((revenue − cost of gSignature) ÷ cost of gSignature × 100%).
• Total monthly ROI: 572.75% (according to the calculator model).
Conclusion: based on the assumptions in the example, gSignature “pays for itself” within the first month — and every subsequent 30 days consolidates the cost advantage and repeatable flow of leads.
Where do the operational savings come from?
Before implementation, part of the organization wastes time on:
• manually creating and updating email signatures and email footers,
• “sending samples” to employees and corrections,
• differences between email clients,
• implementing seasonal variants (Black Friday, Cyber Monday, holidays),
• compliance checks (GDPR, clauses, current data).
After implementation:
• central templates and one-click publishing,
• maintenance drops to the assumed “maintenance %”,
• no messing with HTML/CSS (no-code editing or email signature generator),
• consistency and compliance regardless of device and email client.
Where does the additional revenue come from?
This is the effect of micro-CTA: a permanent, honest space for redirection to valuable content, e.g., “Schedule a demo,” “Download case study,” “Sign up for a webinar.” The calculator takes into account:
• CTR from e-mail signatures → website visits,
• conversion of visits to leads → leads, • conversion of leads to customers → new MRR.
You decide whether to include only traffic from CTAs in the model, or also clicks on sections such as “About us,” “Offer,” and social links. The better you match the CTA to the role (e.g., a different CTA for a salesperson, a different one for support), the higher the real CTR.
How to set the parameters so that the model is reliable?
• Number of emails: take data from ESP/server or estimate based on several departments and average.
• CTR: start with 0.5–1% for standard CTAs. Seasonal campaigns often grow above 1%.
• Conversions: if you don't have data, use industry ranges (e.g., 2–5% WWW→lead and 15–30% lead→customer for B2B).
• Hourly cost: add not only “net salary × multiplier,” but also the actual hourly cost of the teams involved (IT/HR/marketing/sales/administration).
• Maintenance %: after stabilization, 10–20% is a typical result — it may fluctuate seasonally, but the average holds true.
• MRR per customer: use the median, not the average, if you have “whales” that distort the picture.
Frequently asked questions about methodology
Does the calculator also count the impact of branding?
No, we deliberately stick to quantifiable metrics (time × cost + CTR × conversions × MRR). The image effect is a “bonus” that we do not overestimate numerically.
Can the monthly result be extrapolated to a year?
Yes, but check for seasonality (Q4 vs. Q1). It's best to calculate quarterly and annually using real CTR/conversion data from the email signature in campaigns.
Do I have to count traffic from each role separately?
No, but it increases accuracy. Sales usually have a higher CTR on “Schedule a demo,” and HR has a better CTR on “Join us.”
How do I translate the calculator into actions in the product?
• Change CTAs and banners over time (seasonality, campaigns) — central publication.
• Segment templates per department/market/language — different micro-CTAs for different contexts.
• Support no-code: avoid manual HTML editing, rely on generators and variables.
• Measure clicks and opens — data from the Analytics module will allow you to update the CTR in the model.
Step-by-step implementation: quick shortcut
- Select a template and prepare variables (role, department, phone, social, CTA).
- Test 2–3 variants of CTAs and banners internally (A/B per department).
- Publish globally, monitor CTR and leads after 2–4 weeks.
- Enter real data into the calculator and compare with the baseline scenario.
- Leave “maintenance %” as a constant and optimize CTA (the cheapest lever).
Key benefits in one place
• Quick, quantifiable savings on the IT/HR/marketing side (time reduction).
• Additional revenue thanks to micro-CTA in the email signature.
• Visual consistency and legal compliance — no manual “firefighting.” • No-code mode — each department can maintain its signature without HTML.
What's next?
Run the calculator, enter real data, and then compare the results after the first CTA iteration. If you want, start with one department and add more after confirming the CTR/conversion.
Would you like me to help you select the starting parameters (CTR, conversions, MRR) for your industry and prepare the first set of templates for sales and HR?